ASP.NET Website Performance Basics – Part 2
Challenge:
Recap : In last part of ASP.NET Website performance basics, Dax shared basic methodology of troubleshooting ASP.NET Website performance challenges!
Where he shared, what all things we need to do, and why we should do it (Remember W-W-H theory?). And just pointers of How to do it! And as Dax promised, that he will help us to understand how part more [We all know, how well Dax keeps his promises! :)] and here he is.
In this post [Would also name it “ASP.NET Basics”], we will look at following things (Which are very IMP. to diagnose performance issues):
- When you open any website from your browser, what all happens, behind the scenes? — Not related to ASP.NET just basics, how it reaches till your ASP.NET Application
- Now, we’ve reached to ASP.NET Application, after that we will look at — ASP.NET Application LifeCycle — All about — HttpApplication,HttpContext,HttpRuntime, HttpModules etc.
- Request Queuing
- Major Performance killers ( Hanging Requests, Session can slowdown your application — Thread Agility Issue, Exceptions and performance co-relation, MaxConnections, High GC, Contentions, App Pool Recycle, Memory leak)
Above topics sounds similar? Very Basic? (Back to Basics, Stick to basics. Because a basic always works!) But still unknown? (During our interview sessions, we ask these questions to most of our candidate, And so less can answer it)Don’t worry, we will learn it, So, as Dax and his team!
Here we go!
Solution:
When you open any website from your browser, what all happens, behind the scenes?
You might know this question or learnt it during your college days. And If you are pretty much confident you know this you can skip it. But Dax recommends that even though you know it. It would be a good idea to brush up this stuff.
Because while working on performance stuff, you need to know about everything starting from Client’s Browser, DNS, Firewall, Switch — You no need to be expert in this subject. But when you troubleshoot it, You should know all these players very well.
My favorite — one is from MCTS 70-528 exam book – Chapter1-Lesson1 – Understanding the Players
Another good articles:
http://www.codeproject.com/Articles/121096/Web-Server-and-ASP-NET-Application-Life-Cycle-in-D
http://www.codeproject.com/Articles/73728/ASP-NET-Application-and-Page-Life-Cycle
Good to remember about M-H-P-M
http://www.codeproject.com/Articles/87316/A-walkthrough-to-Application-State
Thanks a lot to author of above articles. It clarifies everything. So, now you know what all happens — from browser till server — a request goes through a journey and then gets served!
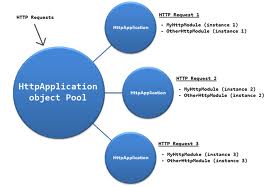
Here you must’ve seen about HttpApplication object, this guy is very critical while serving your requests. HttpApplication consists of HttpModules.
http://blog.andreloker.de/post/2008/05/HttpApplication-instances.aspx
HttpApplication Gotchas:
- ASP.NET may instantiate many instances of HttpApplication as required (. In fact, it will create an instance of the class for each request that is handled in parallel on the server.
- “ASP.NET maintains a pool of HttpApplication instances over the course of a Web application’s lifetime. ASP.NET automatically assigns one of these instances to process each incoming HTTP request that is received by the application. The particular HttpApplication instance assigned is responsible for managing the entire lifetime of the request and is reused only after the request has been completed. This means that user code within the HttpApplication does not need to be reentrant.”
- You can observe asp.net pipeline instance count in the performance counters to see how many instances of your HttpApplication class are pooled at the moment.
- In Integrated Application mode — HttpApplication will called once during application initialization and another during the first request
- When ASP.NET Creates Instance of the HttpApplication class that represents your application, instance of any odules that have been registered are created. When a Module is created, its Init method is called and the module initializes itself. — and the custom module will run for all resource handler, even though resource handler is not an ASP.NET handler
- If you see More number of requests [You can check it via IIS log or performance counter] and Heavy HttpApplication Instances is Normal, Because it means that current HttpApplication Pool was not enough and ASP.NET need to spawn worker processes.
- But if you see less number of requests, and still see heavy HttpApplication instances then it is abnormal. We need to find out slow pages/handlers etc.
- ASP.NET run-time keeps two pools of HttpApplication objects. First is a special pool with HttpApplication objects used for application level events (such as Application_Start, Application_End), Second pool contains instances used in requests to serve all other types of events
- Try this out — http://lowleveldesign.wordpress.com/2011/07/20/global-asax-in-asp-net/
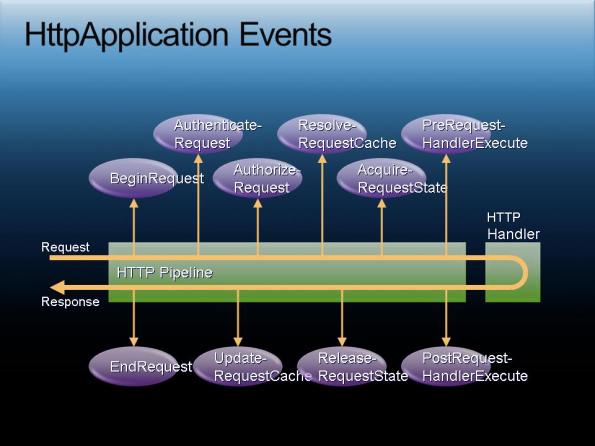
- HttpApplication Events
Other good reads:
- http://support.microsoft.com/kb/312607
- http://blogs.msdn.com/b/carloc/archive/2007/12/19/application-page-and-control-lifecycle.aspx
- http://duartes.org/gustavo/articles/Asp.net-Runtime-Cheat-Sheet-HttpRequest-HttpRuntime.aspx
Huh! Load of things, correct? Useful? Dax says these information is really useful and it will clarify your understanding more on ASP.NET internals!
Request Queuing
It is really good to know about Request Queuing, lot of us already know about Request Queuing — Simple, a Request is queuing. Yes, my dear friend you are right. But there are different level of Queuing happens. And untill and unless you know your request is queued at which level, it won’t be easy to fix it!
Great post! — http://blog.leansentry.com/2013/07/all-about-iis-asp-net-request-queues/
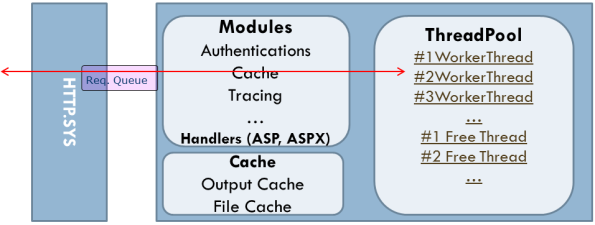
Basically, Request Queuing can happen at mainly 4 levels:
- HTTP.SYS: Application pool queue
- IIS worker process: completion port
- ASP.NET: CLR threadpool queue
- ASP.NET: Integrated mode global queue
- [OR]ASP.NET: Classic mode application queue
Source — http://fullsocrates.wordpress.com/2013/02/28/asp-net-threadstuning-thread-parameters-12-2/
To diagnose, your level of Queuing. Best thing is performance counters [Dax, is going to share more on performance counters in his upcoming posts] and once found you can use tools like FRT, Dump analysis etc. to find a main bottleneck [Yes, Yes — Dax will post on these topics in future for you!]
Major Performance Killers
- Application Pool Recycle/Crash — If your application pool is crashing is or recycling [How Can I check that? You can check EventLog OR if your application got log do log entry [Just a note : Application_End will not get called, when your application crashed unexpectedly a.k.a. Crash] — see — http://weblogs.asp.net/scottgu/archive/2005/12/14/433194.aspx] periodically than it’s not good for your application’s health. Because when application pool gets recycled everything in memory [Session/Cache/Static/Application objects] gets lost, and your application need to server everything from Database and rebuild cache. You can solve this issue by checking EventLog and Configuring+Analyzing Crash Dump.https://kiranpatils.wordpress.com/2012/06/20/is-it-necessary-to-recycle-worker-process-periodically/ and https://kiranpatils.wordpress.com/2010/05/25/goo-to-know-on-asp-net-application-restarts/
- Hanging Requests — Your users are complaining that the site is loading slowly. Requests to your application are hanging. With so many possible causes of request hangs, its difficult to know where to even start. — http://mvolo.com/troubleshoot-iis-hanging-requests/
- Exceptions, handle them gracefully — Exceptions can slowdown your application. Because when your application throws an exception — It Creates objects — CLR needs to do object allocation — And after that GC for those allocation! [Analyze your application logs to see exceptions, and handle them gracefully] — http://blogs.msdn.com/b/tess/archive/2005/11/30/498297.aspx
- %Time in GC — When this time is high, your requests will get paused for a while and your end users will see slow response time during this time. If it is >=10% then you need to dig in to this issue. Also, check for Memory Leak — https://kiranpatils.wordpress.com/2012/06/05/basics-of-memory-leak/
- Contentions — If your CPU is not being utilized and you still see low throughput, you may be suffering from high contention rate. Means your code has lock on shared resources, which is taking time to process, and due to this other requests are going in Queue. Simple concept in locking — “Acquire lock as late as possible, and release it as soon as possible” https://kiranpatils.wordpress.com/2013/01/13/thread-synchronization-basics/
- Session lock – Thread agility issue — Disable session for the pages/handlers, where you don’t need them. https://github.com/angieslist/AL-Redis http://stackoverflow.com/questions/3629709/i-just-discovered-why-all-asp-net-websites-are-slow-and-i-am-trying-to-work-out
http://stackoverflow.com/questions/8068925/redis-backed-asp-net-sessionstate-provider
Good to read resources:
- http://msdn.microsoft.com/en-us/library/ff647787.aspx
- Most recommended — https://www.leansentry.com/try#course
- http://blogs.msdn.com/b/mcsuksoldev/archive/2011/01/19/common-performance-issues-on-asp-net-web-sites.aspx
- http://www.codeproject.com/Articles/23306/10-ASP-NET-Performance-and-Scalability-Secrets
- http://blog.leansentry.com/2013/07/the-server-logs-you-need-to-know-to-fix-any-iis-aspnet-error/
- http://mvolo.com/fix-the-3-high-cpu-performance-problems-for-iis-aspnet-apps/
Sorry for such a long post. But It’s good to clarify basics. Because once it is clear, you can fix any issue!
These are the common performance killers, In upcoming posts, we will see how to diagnose them! Till than Happy Performance Tunning! 🙂


Leave a comment